
Greater Phoenix is not frozen because homeowners are satisfied with their homes. It is frozen because the financial penalty for moving has become too large for many households to justify. Owners may need another bedroom, want less maintenance after their children move out, or simply prefer a different part of the Valley. Yet once they compare today’s prices and mortgage rates with the loan they already have, many choose to remodel, reorganize or remain in place.
That behavior is the mortgage-rate lock-in effect. With the benchmark 10-year Treasury yield at 5.18% on September 24 and the Freddie Mac national average for a 30-year fixed mortgage at 7.03%, financing has become the central constraint on market mobility. Some real-time lender quotes for otherwise strong borrowers are reaching roughly 7.45%, depending on credit, down payment, property type, occupancy, fees, points and lock timing. The practical result is a market with fewer discretionary sellers, fewer qualified buyers and a smaller number of transactions connecting the two.
The market has shifted from hesitation to financial lock in
The phrase lock-in effect describes the disincentive created when a homeowner’s existing fixed mortgage rate is far below the rate available on a replacement loan. Selling does not merely mean leaving a house. For most financed owners, it also means surrendering a long-term debt contract that may be one of the most valuable assets on their household balance sheet.
Federal Housing Finance Agency research found that, for every percentage point by which the current market mortgage rate exceeded a homeowner’s origination rate, the probability of a sale declined by 18.1%. The same study estimated that mortgage lock-in reduced fixed-rate home sales by 57% in the fourth quarter of 2023 and prevented approximately 1.33 million sales between the second quarter of 2022 and the fourth quarter of 2023. Federal Reserve researchers separately estimated that lock-in explained 44% of the decline in mortgage-borrower mobility from 2021 to 2022.
Those national estimates describe exactly what we hear locally at open houses and in listing conversations. Many owners would move if the decision were based only on lifestyle. The financing comparison changes the answer. A low-rate mortgage turns staying put into the default choice, even when the home no longer fits the household particularly well.
The payment math overwhelms the lifestyle benefit
Consider the principal-and-interest payment on a $400,000, 30-year fixed loan. At 3.00%, the payment is approximately $1,686 per month. At the current Freddie Mac average of 7.03%, it is approximately $2,670. At 7.45%, it rises to approximately $2,782. That is about $1,096 more every month than the 3.00% loan for the same amount borrowed, before adding property taxes, homeowners insurance, mortgage insurance or HOA costs.
| Scenario | Rate | Loan amount | Monthly principal and interest |
| Existing mortgage | 3.00% | $400,000 | $1,686 |
| Same balance at weekly average | 7.03% | $400,000 | $2,669 |
| Same balance at observed quote | 7.45% | $400,000 | $2,783 |
| Move up purchase example | 7.45% | $520,000 | $3,618 |
Illustrative principal and interest only. Actual payments and qualifying rates vary.
The move-up example shows why owners describe the replacement payment as nearly double. Moving from a $400,000 balance at 3.00% to a $520,000 balance at 7.45% raises principal and interest from about $1,686 to about $3,619 per month. Higher taxes, insurance and HOA charges may widen the difference. Rates alone do not automatically double or triple a payment, but the rate reset combined with a larger loan balance can do so quickly.
When the first rung stops the property ladder stalls
Housing transactions function as a ladder. A first-time buyer purchases an entry-level home. That seller uses accumulated equity to buy a larger property. The owner of that larger property may downsize, move to another community or purchase a higher-priced home. One qualified buyer at the bottom can therefore support several transactions above them.
When first-time buyers cannot qualify or cannot accept the payment, the first transaction never occurs. The starter-home owner cannot sell and move up. The next seller loses a buyer. The chain weakens all the way through the market. This is why affordability pressure at the entry level does not remain confined to condos, townhomes or smaller single-family homes. It reduces liquidity across multiple price ranges.
The market therefore faces pressure from both directions. Existing owners are reluctant to sell because they would surrender a favorable mortgage, while would-be buyers are constrained by the cost of the new mortgage. Lock-in suppresses supply, but the rate shock also suppresses demand. In a balanced or weakening market, the demand loss can be more visible than the inventory reduction, producing longer marketing times and more negotiating leverage for the buyers who remain.
What the listing success rate measures
The Listing Success Rate is the percentage of listings leaving the market that closed successfully rather than expiring or being canceled. The Cromford Report calculates it by comparing listings sold during the measurement period with the total number of listings sold, expired or canceled during that same period.
The formula is straightforward: sold listings divided by sold plus expired plus canceled listings. A 68% success rate does not mean 32% of every listing currently active will fail. It means that, among listings that reached an outcome during the measured period, 68% closed and the remaining 32% expired or were canceled. Because the measure is based on terminated listings, it is a useful gauge of whether sellers are converting listings into completed sales.
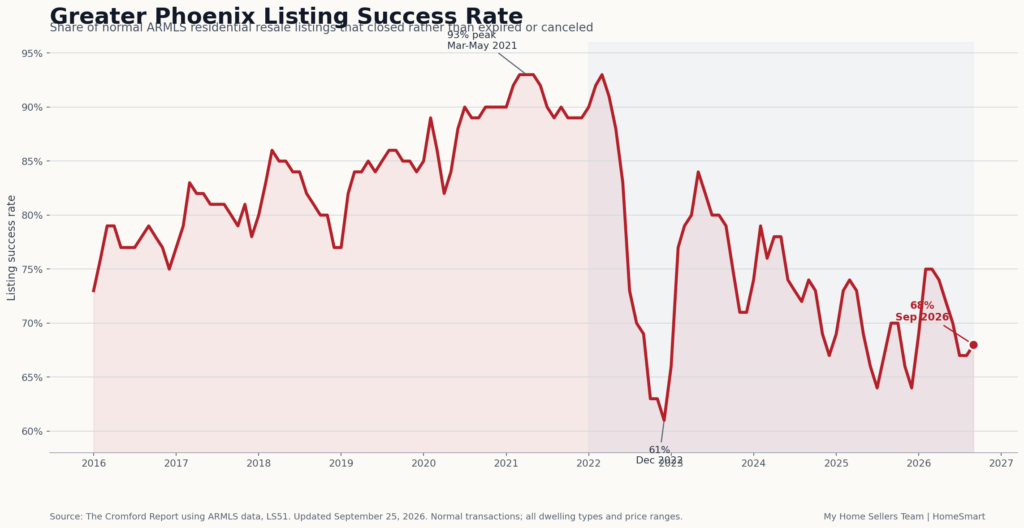
Greater Phoenix normal residential resale listings | All dwelling types and price ranges
The chart shows a market with less conversion
The September 2026 listing success rate is 68%. That is one point higher than July and August, but seven percentage points below the 75% reading recorded in February and March. It is also dramatically below the 93% peak reached in March through May 2021 and again in March 2022.
The long-term pattern matters. Listing success collapsed from 93% in March 2022 to 61% by December 2022 as mortgage rates reset higher. It recovered to 84% in May 2023, but the recovery did not hold. Success trended lower through 2024 and 2025, touching 64% in July and December 2025. The early-2026 seasonal improvement reached 75%, followed by a retreat to 68% by September.
In practical terms, a lower success rate means sellers face a greater risk of spending weeks or months on the market without reaching a closing. It often reflects some combination of affordability constraints, optimistic pricing, property-condition issues, weak presentation, limited buyer urgency and sellers deciding not to accept the market’s terms. The rate is not a direct measure of price decline, but it is a clear measure of reduced transaction efficiency.
Inventory is being created by slower absorption
Greater Phoenix inventory is not rising in a straight line every month. ARMLS reported 23,406 active listings in August, down 1.43% from 23,745 in July. At the same time, median days on market increased from 61 to 64 days. That combination is important: even without a fresh monthly surge in listings, homes can accumulate because the market is absorbing them more slowly.
The result feels like increasing inventory to an active buyer because more alternatives remain available at the same time. A smaller buyer pool can compare more properties, wait for price adjustments, request concessions and walk away from homes with condition or location drawbacks. Sellers are no longer negotiating only against the buyer across the table; they are competing against every similar active listing the buyer could purchase instead.
ARMLS also reported an August median sales price of $445,000, 1.14% above the prior year, while median price per square foot was down 1.12% year over year. That is consistent with a market that is softening through mix, concessions, condition and value per square foot before showing a dramatic decline in the headline median price.
The seller pool is becoming less discretionary
When the financial case for a voluntary move disappears, the listings that do reach the market increasingly come from circumstances where moving is not optional. Common examples include divorce or separation, employment relocation, death and probate, health or caregiving needs, financial distress, or a household that has already committed to another property.
This does not mean every current seller is distressed, and it does not mean desirable homes cannot sell quickly. It means the marginal discretionary seller is more likely to stay put. Owners who can wait often choose to wait, while owners who must sell are more exposed to the buyer’s negotiating leverage. That changes the composition of inventory even when the total number of listings appears stable.
Why the 10 year Treasury matters more than the Fed headline
Thirty-year mortgage rates do not move point for point with the Federal Reserve’s overnight policy rate. Mortgage-backed securities are long-duration assets, so lenders price them using longer-term bond yields, inflation expectations, prepayment risk, market volatility and investor demand. The 10-year Treasury is the most widely watched benchmark because its maturity and risk profile provide a reference point for longer-term borrowing costs.
The Treasury’s official 10-year constant-maturity rate rose from 4.96% on September 22 to 5.11% on September 23 and 5.18% on September 24. That 22-basis-point increase in two trading days was a substantial repricing. Mortgage rates do not always adjust by the same amount on the same day, but a rapid move in the 10-year generally puts upward pressure on lender rate sheets and can widen the mortgage spread when volatility is high.
Freddie Mac’s 7.03% weekly average represents conventional, conforming, owner-occupied purchase applications collected nationally. It is a benchmark, not a promise. A borrower’s actual quote may be below or above it. A rate near 7.45% can be entirely plausible for a specific transaction even when the weekly national average is lower, particularly after a sharp bond-market move or when the loan has pricing adjustments.
What buyers and sellers should do now
For sellers, the market rewards preparation and accurate pricing. A home that begins above the competitive range may lose its strongest launch period and become one of the listings that later expires or cancels. Professional photography, video, clear property information, broad digital exposure and condition-based pricing matter more when buyers have alternatives. Concessions can sometimes preserve the headline price while improving affordability through a rate buydown or closing-cost credit, but the structure must be compared with a direct price reduction.
For buyers, more negotiating power does not eliminate the affordability problem. The opportunity is to negotiate the total transaction: price, seller-paid closing costs, repairs, rate buydowns, appraisal protection and timing. Buyers should qualify using a payment they can carry without depending on a future refinance. Refinancing may become available later, but it should be treated as a possibility rather than the foundation of the purchase decision.
For homeowners considering a move, the correct first step is a full side-by-side analysis. Compare net proceeds, replacement loan amount, monthly principal and interest, taxes, insurance, HOA fees, maintenance, commute and lifestyle value. Some moves will still make sense. Others will not. The point is to make the decision with complete numbers before listing the current home or committing to the next one.
The bottom line
The lock-in effect is now locked in because the gap between many existing mortgages and current replacement financing has become too large to ignore. It is suppressing voluntary listings, reducing household mobility and weakening the transaction chain that normally begins with a first-time buyer. At the same time, rates near or above 7% are shrinking the qualified buyer pool faster than available homes are being absorbed.
The 68% listing success rate captures the consequence: a materially smaller share of listings is reaching a successful closing than during the high-liquidity years. This is not a market in which nothing sells. It is a market in which the right price, condition, marketing and financing strategy determine which listings sell and which ones become part of the unsuccessful 32%.
If you are considering selling or buying in Greater Phoenix, My Home Sellers Team can prepare a property-specific pricing and payment analysis before you make a commitment. Visit lessfeesmorevalue.com or myhomesellersteam.com to learn more.
