
Here are the basics — the ARMLS numbers for October 1, 2025 compared with October 1, 2024 for all areas and property types:
- Active Listings: 24,450 versus 19,643 last year — up 25%, and up 5.2% from 23,238 last month
- Pending Listings: 4,274 versus 4,349 last year — down 1.7%, but up 3.0% from 4,149 last month
- Under Contract Listings: 7,391 versus 7,261 last year — up 1.8%, and up 1.8% from 7,260 last month
- Monthly Sales: 6,141 versus 5,484 last year — up 12%, and up 3.6% from 5,928 last month
- Monthly Average Sales Price per Sq. Ft.: $287.14 versus $284.77 last year — up 0.8%, and up 2.2% from $280.97 last month
Market Insights
- September showed a noticeable uptick in buyer activity as lower interest rates early in the month encouraged more contracts and closings. Listings under contract rose 1.8% compared to a year earlier, while closed sales were 12% higher than last year. However, part of that increase is due to an extra working day in September 2025, which accounts for roughly 5% of the difference.
- Home prices also rebounded after four months of slight declines, now sitting marginally higher than the same time last year. A portion of that gain stems from a shift in the sales mix, as luxury homes regained traction and made up a larger share of recent closings. However, it’s not all favorable for sellers. Inventory rose by more than 5% over the past month, and this upward supply trend is likely to continue through November. The surge in buyer demand that began in mid-August has largely tapered off by late September, coinciding with interest rates climbing back up after their mid-month dip.
Looking Ahead
- As we move deeper into the fourth quarter, the market typically enters a cyclical slowdown tied to the holiday season. Buyer demand tends to soften as people shift focus toward year-end priorities, travel, and family gatherings. Likewise, inventory often declines toward the end of the year as some sellers pull their homes from the market until the new year, waiting for stronger spring demand.
- Overall, while pricing remains relatively stable, seasonal patterns and fluctuating rates suggest a calmer finish to the year — providing an opportunity for serious buyers to negotiate and for sellers to position strategically ahead of the new-year market activity.
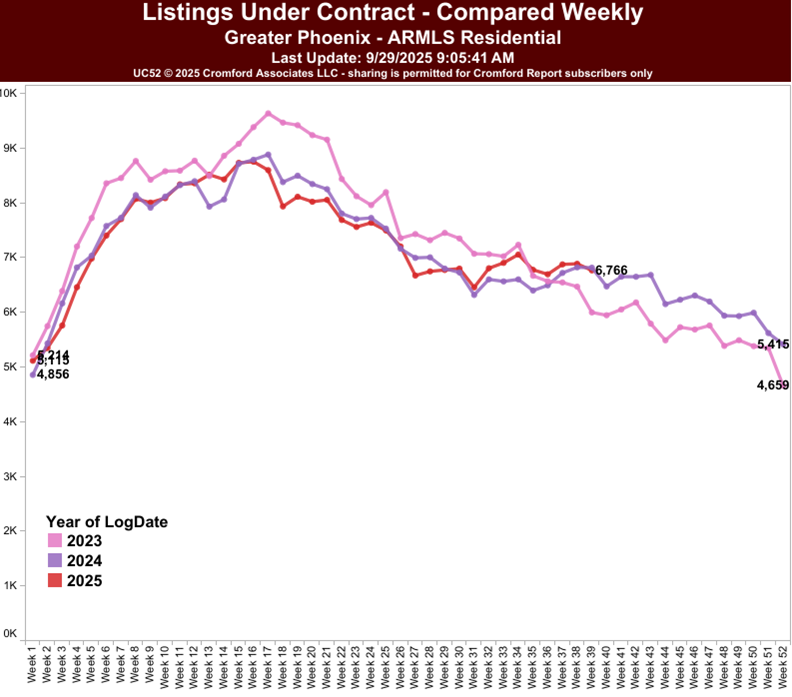
With 30-year mortgage rates easing to 6.3%, contract activity across Greater Phoenix has ticked upward in recent weeks. The luxury market is leading the charge, with homes over $1 million up 6.4% year-over-year and nearly 21% higher than in 2023.
The $1M–$1.5M segment saw the strongest growth—up 15.8% and trending upward for nine consecutive weeks. While contracts between $2M–$10M dipped slightly from last year, there are 10 homes over $10M under contract, a 30% increase from the same time in 2024.
Overall, the data suggests renewed buyer confidence at the high end, even as broader market activity cools seasonally heading into the holidays.